Podium Driver Data Analysis
Analyzing data in Podium
- Written by Scott Barton of ProFormance Coaching
You can use Podium.live to find areas on the track and analyze your driving techniques to improve on in order to reduce your lap times and become a better driver.
Setup and Configure Podium
The first thing you want to do is find a few of your fastest laps and click on 3 of them. Ideally they will be laps close to each other as what we are analyzing is your consistency. Ideally, if you have a pro driver or coach who can set some reference data for you, click on your two fastest laps and their fastest lap. This will really show you where you can find time. Click on the fastest lap last, as the last lap you click on is used as the reference lap for the Time Gap Graph. Also make sure your graphs are by Distance and not Time. Now hide all the graphs we don't care about except Speed, Time Gap, AxcelX, AxcelY. You can keep RPM, Gear, Pitch and Yaw if you want. Customize the graphs so that the Min and Max values make sense for the data shown and give you the best resolution. Ie. If your car only rev's to 6000RPM, but max on the graph is 10000, maybe change the max to 6500.
Speed Trace Graph - Find the inconsistencies
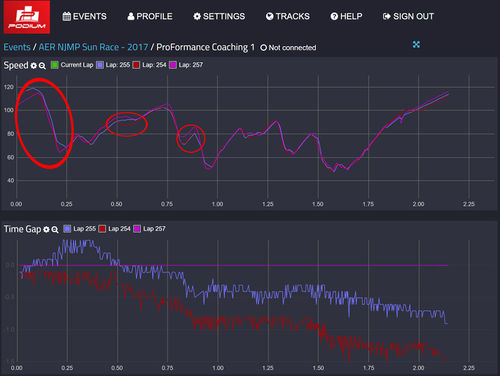
Looking at the Speed graph, see where the areas of most inconsistency is. These are the turns (including braking zones) where the speed trace lines don't match up, or overlay on top of each other. You have different speeds through these sections with each lap. Looking at the data, you are trying to find out which sections you need to work on, which ones you are giving up the most time on (lowest hanging fruit), and then figure out why you where slower and how you can consistently be faster there.
Time Gap Graph - Find the low hanging fruit
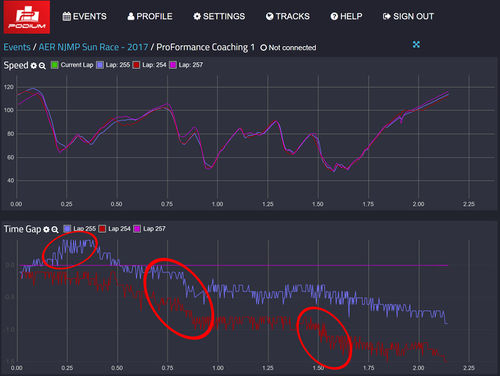
Looking at the Time Gap graph shows you exactly how much time you are losing (or gaining) in a section. Look for the sections where the line rises or falls sharply. These are the areas you need to focus on and can learn from. The sections with the most amount of time lost (how far the dip is), are the sections you want to work on first (low hanging fruit). If your fastest lap was the last selected, it should be the reference lap. When the Time Gap line on another lap falls sharply, you are losing time in that section, when the line rises sharply, you are gaining some time back. You need to pay attention to both areas. Where the line rises means you probably could have gone faster there on your fastest lap.
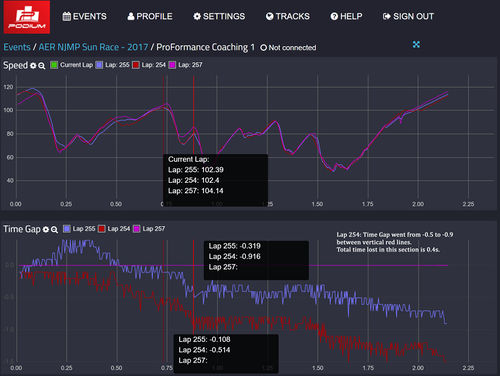
To see how much time you are losing in a section, place the cursor where the time gap starts to dip or rise rapidly and note the current Time Gap for that lap. Then move the cursor to where the time gap line starts to level off and note the Time Gap for that lap at that point. The difference between those two Time Gap times, is how much time you are losing in the section. The sections with the largest time lost are the ones you should work on first.
The Why - Analyzing the data
Now that we know which sections you need to work on and which of those sections you should work on first, we need to analyze why you were slower in those sections. Go back to the speed trace graph and look at the section you are losing the most time on. Look where the difference starts happening. Is it in the braking zone, mid corner, or track out?
If it is in the braking zone, are you braking too early, too little, too hard, is your pressure inconsistent throughout the braking zone. Are you not transitioning from throttle to full brakes fast enough, is your heel-toe messing up your braking pressure (check Accel graph as well)
If mid corner speed; are you slowing down too much, did you not slow down enough and overcooked the turn a little, are you coming off the brakes at the right time, Is your turn in point the same, did you make it to the apex, how is your transition back to throttle (check Accel graph as well).
If corner exit speed (and speed down following straight) is down; how was your mid corner speed, when did you get back onto throttle, when did you get to full throttle (check Accel graph), did you hit the apex and track out, what were your shift points (also check RPM, Gear, Track Map and/or Accel graphs).
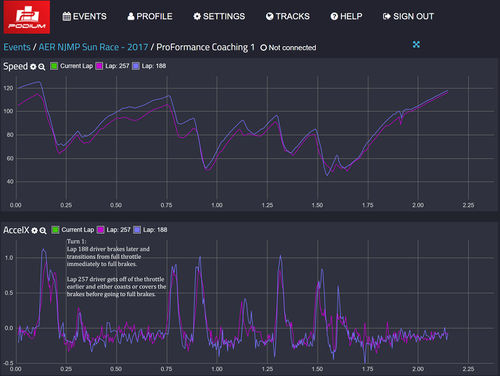 Pro Tip: click image and read description to learn how to read the speed trace to see the differences between a pro driver and an advanced driver in the same car.
General Data Analysis tips
Unless comparing to a pro driver, you only need to look at one lap at a time for this, use your best lap. Compare to your second best lap to see if they are similar to rule out an anomaly.
Braking
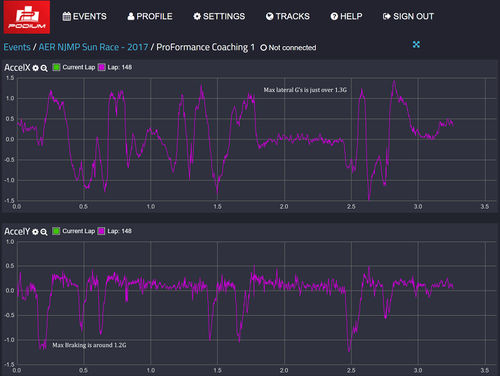
Look at the Accel graph that shows acceleration and braking. This will either be AccelX or AccelY depending on how you mounted and setup your RCP. You can tell which is your acceleration/braking graph because braking is always a much larger curve than acceleration. Look for a graph with 0.2-0.3g's one side (acceleration) and over 1.0 g's on the other side (braking).
Threshold braking - using all the tires available traction
Your max braking G's should be similar to your max turning G's (within about 0.2g). If they are not close, it means you are not using your tires full potential for which ever graph is lower. Ie, if you are turning at 1.4g's, but your braking is only 1.0g, you can brake harder.
Throttle to Brakes transition
Looking at the acceleration/braking graph, find the areas where you are braking hard for a while. Look at how you transition from throttle to brakes. It should be a very immediate and steep transition. If it dips down a little bit and then falls sharply, it means you are coasting or covering the brakes before really applying them. In almost all cases, you should try to go from full throttle to full brakes on these larger braking zones.
You can also see this in the speed trace. As you are accelerating it should be slowly rising and then immediately drop fast when you brake. If after accelerating, it levels out or drops slowly, before the real deceleration begins, it means they were either coasting or just lightly adding brakes before actually getting on the brakes hard.
Consistent braking pressure throughout max brake zone
Imagine drawing a straight line from the top of the where the braking starts as the line drops fast, to where the line starts to level off. Your braking trace should be very close to this straight line. That would mean you applied the brakes quickly and consistently throughout the braking zone which is what we want. If your braking g-force trace is bowed in, that means you got on the brakes hard initially and then let off as you got closer to the turn in point. If your braking trace is bowed out, that means you initially got on the brakes a little light and then added more braking pressure as you got closer to the apex. In both cases, start braking a little later in order to force yourself to brake evenly throughout the brake zone, you should still be coming off the brakes at the same time and not later.
You can also see this in the speed trace. The transition from acceleration to braking should look almost like a 90* angle. It should then be a straight line down. If it is rounded right before the real deceleration starts, or the line is not straight, you need to work on braking later and harder.
Heel-Toe
Look for a little blip in the braking trace. Or look for the speed trace to fall sharply, start to even out just the tiniest bit, then continue to fall sharply. This is where you are heel-toeing and let off a little brake pressure as you did so. You would need to work on your heel-toe without effecting the braking pressure. You can use the RPM trace to see exactly where you heel-toed under braking.
Consistent braking at all braking zones
Now draw a straight line through all of your major braking zones (both on the speed trace and on the accel/braking graph). Assuming the track conditions are the same (not going up or down a hill) at the brake zones, all these lines for each graph should be almost perfectly parallel to each other. This would mean you are using the brakes consistently at every braking zone. If any are less steep than others, you can get on the brakes harder in those less steep sections.
Brake release and trail braking
If you have a pro or coach lap time to compare too, take a look at how they are transitioning off of the brakes and onto throttle at each section (will vary by turn) compared to your fastest lap. Are they coming off the brakes sooner and transitioning to part throttle or maintenance throttle, are they quickly rolling back to full throttle in that section. Where in the turn are they doing all this. Are they braking later and trail braking? You can see trail braking where after max braking g's, the g-forces slowly come down for a while before dropping back towards 0g.
Lateral G's
Look at your lateral g's. The max g-forces should be the same left to right. If not you either need to work on turning to that side (most US tracks are clockwise so we get a lot more practice turning right than we do turning left), or it could be indicative of a setup problem with the car.

