File:PodiumBrakeTransition.jpg

Original file (1,902 × 1,432 pixels, file size: 662 KB, MIME type: image/jpeg)
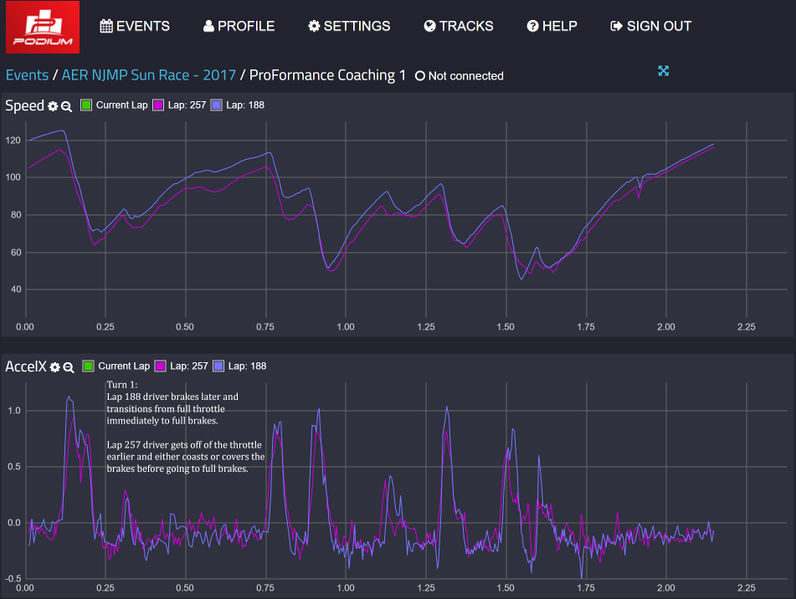
Looking at the graph for the transition from acceleration to braking, It should be a very immediate and steep transition. If it dips down a little bit and then falls sharply, it means you are coasting or covering the brakes before really applying them.
Analyzing the speed trace between the pro driver on lap 188 and the advanced driver on lap 257 tells us a lot of things. This is a lap at NJMP Thunderbolt. The advanced driver on lap 257 has a significantly reduced speed on the main straight leading into Turn 1. Normally this would be a result of slow exit speed out of the preceding turn, but because of the huge difference in speed I would assume it is due to traffic. Looking at the far end of the graph we see that on this lap the speed difference wasn't nearly that much so confirms there was an outside force causing the slow speed down the main straight for lap 257.
Comparing the braking zones for lap 257 and lap 188, we see the pro driver on lap 188 brakes later even though they are carrying more speed and transitions to full brakes immediately. Notice it rises slowly under acceleration and immediately drops quickly in a straight line with the pro driver. The pro driver's line is almost a 90* angle with no rounded edges. We see the advanced driver lift off the throttle and coast briefly before applying full brakes. Notice the line for 257 rises slowly under acceleration, slowly transitions downwards before dropping fast. The advanced drivers line is quite rounded as it transitions from acceleration to braking.
Going into T1, we see the pro driver getting off the brakes earlier, trail brakes a little bit, before transitioning back to throttle. The advanced driver brakes longer, enters slower, but gets back to throttle immediately. The pro driver carries more speed through T1 and into T2.
Going into T2 the pro driver again brakes later and less, carrying a lot more speed into and out of T2. T3 is just a breathe off the gas (and/or a shift), where the advanced driver either lifts for a while or brushes the brakes, significantly reducing speed and losing a lot of time (over a second) through T3 all the way to T4.
For T4, the pro driver brakes later and harder (notice it's a little more steeper than the advanced driver), but more importantly gets off of the brakes a lot sooner carrying a lot more speed through T4 and into T5 shaving about 0.4 seconds.
For T5, both brake down to about the same speed, but the pro immediately gets back onto the gas and is able to accelerate a lot longer down the straight to T6, shaving almost a full second there.
Going into T6, again we see the pro brake much later, gets down to the same minumum speed as the advanced driver, but then immediately gets back onto the throttle, where as the advanced driver brakes much earlier and just carries the same speed throughout all of T6, getting back to throttle much later.
T7 the pro brakes later and comes off the brakes earlier, carrying that extra speed down the straightish section past the villas.
T8 (the almost 180* right hander entering the octopus section) is very interesting. The pro driver goes from full throttle to full brakes, and then immediately back to throttle. The advanced driver, comes off the throttle earlier, coasts for a little bit, applies the brakes hard , then eases up before transitioning back to throttle.
The pro driver accelerates for a bit and then brakes before the left hand sweeper of the octopus section, whereas the advanced driver just used maintenance throttle to maintain a constant speed before entering the left hand sweeper. They both accelerate out at about the same speed, but the pro stays flat all the way to the main straight where the advanced driver lifts slightly for each turn of the esses. The large dip in the graph is most likely due to lost GPS signal from going under the bridge. Notice that once on the main straight the speeds are fairly similar.
Now that we know the differences, we need to take a look at the Time Gap graph to see how much each of these differences account for, and work on the ones with the largest amount of time lost.
File history
Click on a date/time to view the file as it appeared at that time.
| Date/Time | Thumbnail | Dimensions | User | Comment | |
|---|---|---|---|---|---|
| current | 22:32, 15 December 2017 | | 1,902 × 1,432 (662 KB) | Sbarton (talk | contribs) | It should be a very immediate and steep transition. If it dips down a little bit and then falls sharply, it means you are coasting or covering the brakes before really applying them. |
You cannot overwrite this file.
File usage
The following page uses this file: